The Goldmine in Your Shopping Carts: An Introduction to Market Basket Analysis
Every e-commerce business owner knows their best-selling products. But a more profound question often goes unanswered: which products help sell other products? The answers are not found in complex market research but are hiding in plain sigh within the digital shopping carts of customers who have already completed their purchases. This existing transactional data represents a potential goldmine of strategic information, and Market Basket Analysis is the map to uncovering it.

This powerful technique is the secret behind the success of many retail giants. When Amazon displays a "Frequently bought together" section, it is leveraging Market Basket Analysis to drive a significant portion of its sales. Similarly, when Netflix's recommendation engine suggests the next series to binge-watch, it is applying the same principles of association to keep users engaged and subscribed. One of the most famous, albeit possibly apocryphal, case studies involves a retailer discovering that customers who bought diapers on Thursday evenings also frequently bought beer, leading to a strategic placement of the two products and a subsequent surge in sales. This example perfectly illustrates the core power of the analysis: to uncover non-obvious patterns that can lead to significant financial gains.
At its core, Market Basket Analysis (MBA), also referred to as affinity analysis, is a data mining technique used to discover relationships and associations between products derived from customer purchasing patterns. It examines the "basket" or "itemset" the complete collection of items purchased by a customer in a single transaction to identify which items frequently co-occur. The name of the Apus Nest platform is inspired by the Common Swift, or Apus apus, a bird renowned for its architectural skill, building its nest from materials it gathers while in flight. In this same spirit, Apus Nest is designed to help businesses gather valuable insights from their existing data streams to construct a stronger, more resilient, and more profitable enterprise.
The primary goal of Market Basket Analysis is to shift a business's focus from single-product performance to understanding the intricate web of relationships between all products in its catalog. This understanding forms the bedrock of numerous advanced growth strategies. Historically, the complexity of the algorithms behind MBA, such as Apriori and FP-Growth, meant that this level of analysis was accessible only to large corporations with dedicated data science teams. However, the emergence of accessible tools has democratized this powerful capability. Platforms like Apus Nest make this enterprise-level strategy available to businesses of any size, particularly those on platforms like Shopify and WooCommerce, by offering straightforward reporting and demonstrations. This empowers any e-commerce manager to move beyond simple sales reports and begin leveraging predictive insights that were once the exclusive domain of industry titans.
The Language of Your Customers: How Market Basket Analysis Works
Market Basket Analysis functions by generating what are known as "association rules". These are not complex algorithms but simple, powerful "if-then" statements that describe a relationship observed in the data. Understanding the structure of these rules is the first step toward interpreting the results.
An association rule is composed of two main parts: the antecedent and the consequent.
- Antecedent: This is the "if" part of the rule. It represents an item or a set of items that are already present in a customer's shopping basket. For example, in a grocery context, an antecedent could be {Peanut Butter, Bread}.
- Consequent: This is the "then" part of the rule. It represents the item or set of items that are frequently added to the basket when the antecedent is present. Following the example, the consequent would be {Jelly}.
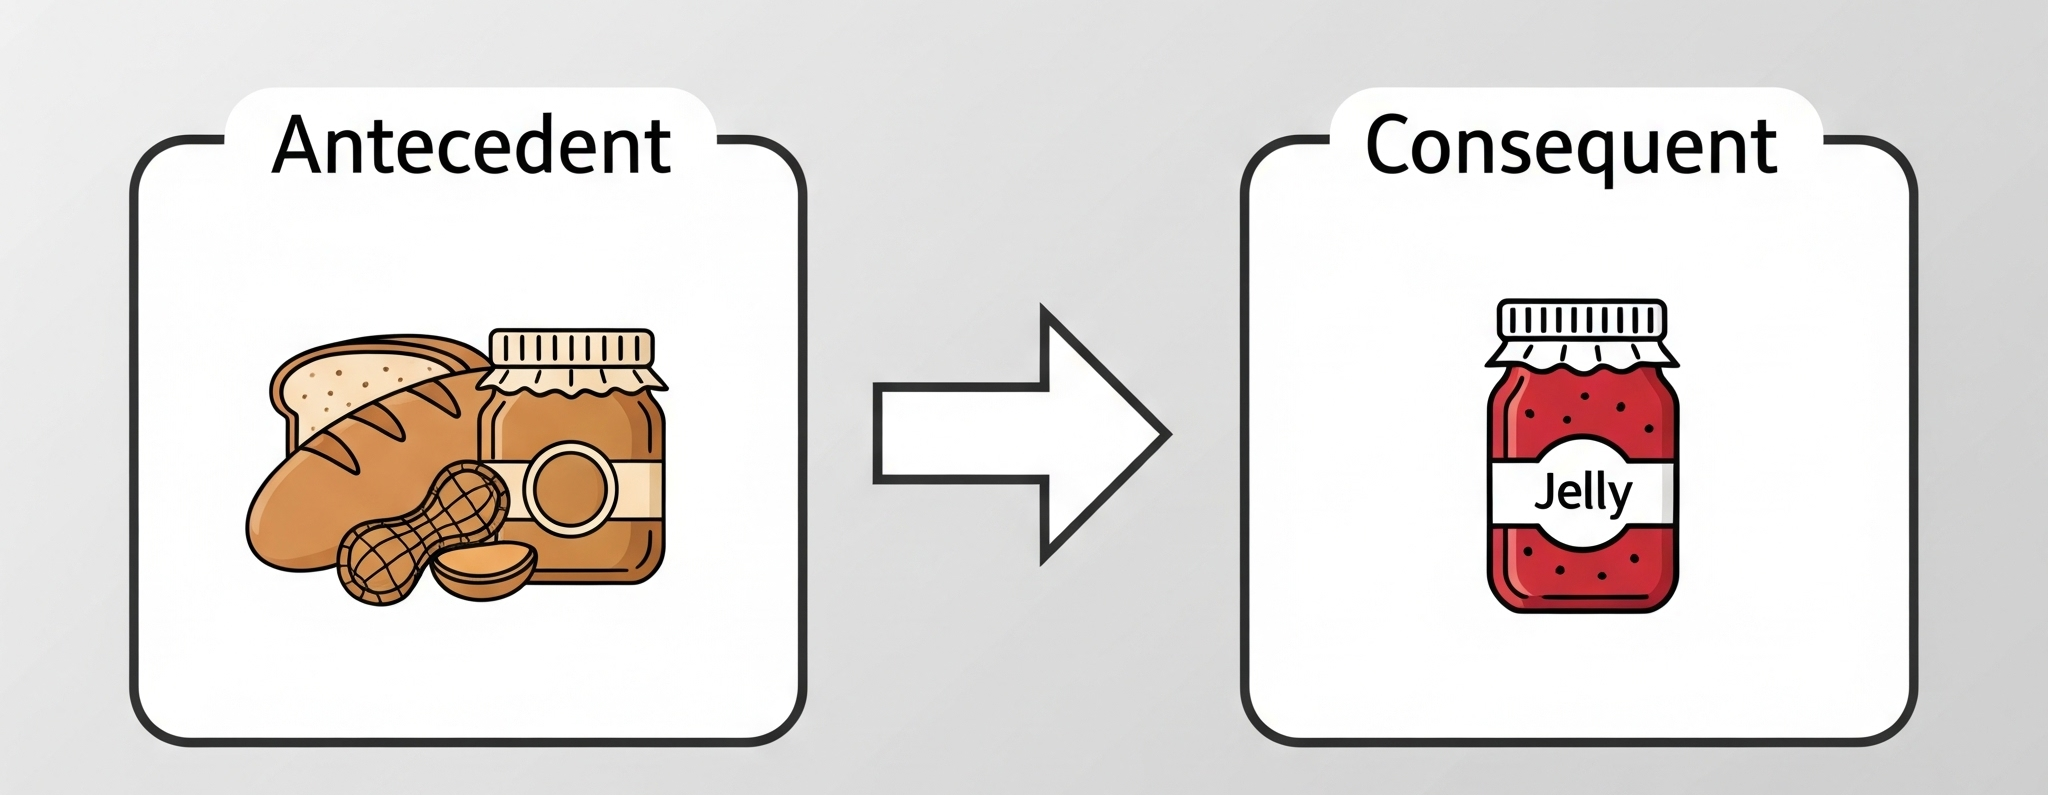
The complete association rule would be formally expressed as: If a customer buys {Peanut Butter, Bread}, then they are likely to also buy {Jelly}. This simple statement, when generated from thousands of transactions, becomes a highly reliable indicator of customer behavior.
It is critical to understand that these association rules imply co-occurrence, not necessarily causation. The analysis reveals that customers who buy peanut butter and bread also tend to buy jelly; it does not definitively prove that the purchase of the first two items causes the purchase of the third. This distinction is important for maintaining analytical rigor, but the strategic value of the strong correlation remains immense.
The beauty of this technique lies in its data requirements. To perform a comprehensive Market Basket Analysis, a business does not need to invest in new data collection methods. The necessary information already exists within its standard transactional data, which every e-commerce platform records, whether it's Shopify, WooCommerce, or another leading solution. This data typically includes an order or invoice identifier and a list of all products contained within that single transaction. An analytics platform simply taps into this existing data stream to begin uncovering these valuable patterns.
Measuring What Matters: Support, Confidence, and the Power of Lift
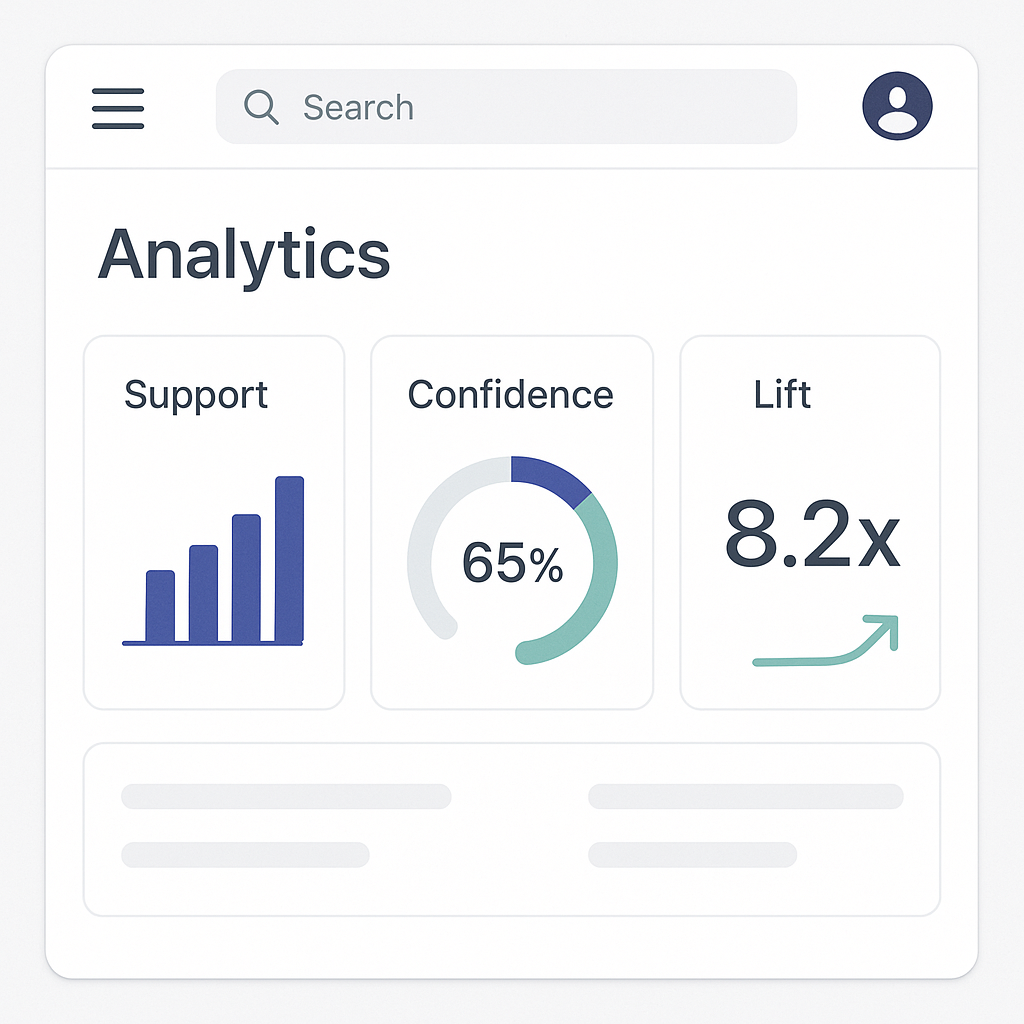
Not all discovered associations hold the same strategic value. To distinguish between a random coincidence and a statistically significant pattern, Market Basket Analysis relies on three primary metrics: Support, Confidence, and Lift. These metrics quantify the strength and reliability of each association rule, allowing businesses to focus their efforts on the opportunities with the highest potential for return. While a platform like Apus Nest automates the complex calculations, a foundational understanding of these metrics empowers marketers to interpret the results with expert precision.
Support: The Popularity Metric
Support measures the overall frequency of an itemset within the total number of transactions. A high support value signifies that the product pairing is a common occurrence, making it a potentially good candidate for broad-based promotions or bundling strategies.
Support({A, B}) = (Number of Transactions containing both A and B) / (Total Number of Transactions)
For example, if an online store processed 1,000 orders in a month and 50 of those orders contained both a Yoga Mat and Yoga Blocks, the support for this itemset would be 50 / 1000, or 5%.
Confidence: The Predictability Metric
Confidence quantifies the reliability of the association rule and is the cornerstone of effective cross-selling and recommendation engines.
Confidence (A → B) = (Number of Transactions containing both A and B) / (Number of Transactions containing A)
Using the previous example, if a total of 200 orders contained a Yoga Mat (regardless of what else was in the basket), the confidence of the rule {Yoga Mat} → {Yoga Blocks} would be 50 / 200, or 25%.
A crucial nuance in understanding confidence is that the direction of the rule matters significantly. The confidence of {A} → {B} is not the same as the confidence of {B} → {A}. This is because the calculation's denominator changes based on which item is the antecedent.
Lift: The "True Relationship" Metric
Lift measures how much more likely the consequent is to be purchased when the antecedent is present, compared to its baseline probability of being purchased on its own. It corrects for the general popularity of the consequent, thereby revealing the true strength of the influence one product has on another.
Lift (A → B) = Confidence(A → B) / Support(B)
The value of lift provides a clear guide for action:
- Lift > 1: Indicates a positive association. The presence of the antecedent increases the likelihood of the consequent being purchased. This is the signal marketers are looking for, and the higher the lift, the stronger the relationship.
- Lift = 1: Indicates no association. The two products are statistically independent.
- Lift < 1: Indicates a negative association. The products may be substitutes.
Continuing the yoga example, suppose Yoga Blocks appear in 10% of all transactions (their baseline support). The lift for the rule {Yoga Mat} → {Yoga Blocks} would be its confidence (25%) divided by the support of Yoga Blocks (10%), which equals 2.5. A lift of 2.5 means that a customer is 2.5 times more likely to purchase yoga blocks if they already have a yoga mat in their cart compared to any random customer. This is a powerful, actionable insight.
Confidence alone can sometimes be misleading. Lift acts as an antidote to this "fallacy of popularity" by normalizing for how popular the second item is on its own. This ability to surface the most potent and unexpected opportunities is what makes lift the ultimate measure of a true product affinity.
| Metric | What It Measures | The Business Question It Answers |
|---|---|---|
| Support | The fraction of all your orders that contain a specific product pair. | "How often do people actually buy these two things together?" |
| Confidence | The probability that someone will buy Product B, given they are buying Product A. | "If a customer puts Product A in their cart, what are the chances they'll also buy Product B?" |
| Lift | The increase in the probability of buying Product B when Product A is present. | "Does buying Product A really make someone more likely to buy Product B, or is B just a popular product?" |
From Data to Dollars: Your Action Plan with Apus Nest
Understanding the theory behind Market Basket Analysis is valuable, but its true power is realized when these insights are translated into tangible, revenue-generating actions. The following use cases demonstrate how these reports can be used to drive immediate and sustained business growth.
Use Case 1: Proactive Opportunity Discovery with Recent Order Analysis
The goal of this approach is to analyze the most recent sales data to identify immediate opportunities for growth. An ApusNest report might look like this:
| If a customer buys... (Antecedent) | Then they also buy... (Consequent) | Support | Confidence | Lift |
|---|---|---|---|---|
| {Laptop} | {Wireless Mouse} | 2.1% | 65% | 8.2 |
| {Coffee Pods} | {Milk Frother} | 0.8% | 30% | 12.5 |
| {Red Paper Plates} | {Red Paper Cups} | 4.5% | 72% | 3.6 |
| {Shampoo Brand A} | {Shampoo Brand B} | 0.2% | 3% | 0.4 |
Interpreting this report allows for immediate, data-driven actions:
Action 1: Supercharge Your Cross-Selling
The first row, {Laptop} → {Wireless Mouse}, is a classic cross-sell opportunity. The high confidence (65%) and very high lift (8.2) tell us that laptop buyers are 8.2 times more likely to purchase a wireless mouse than the average customer. This insight can be used to populate recommendation sections like "You might also like..." on the product page and in the cart.
Action 2: Create Irresistible Product Bundles
The third row, {Red Paper Plates} → {Red Paper Cups}, shows a combination with high support and confidence. Offering these as a "Complete Party Pack," perhaps at a slight discount, is a proven strategy for increasing the Average Order Value (AOV).
Action 3: Optimize Promotions and Uncover Hidden Gems
The second row, {Coffee Pods} → {Milk Frother}, is a "hidden gem." While its support is low, the lift is exceptionally high. This means the relationship is very strong. A business can strategically run a discount on the popular coffee pods to drive sales of the higher-margin milk frother.
Action 4: Refine Inventory and Identify Substitutes
The final row, {Shampoo Brand A} → {Shampoo Brand B}, shows a negative association (Lift < 1). These products are substitutes. This is crucial for inventory and promotion planning, as promoting both simultaneously would be inefficient.
Use Case 2: Mid-Campaign Analysis & Hyper-Targeted Remarketing
This use case demonstrates a more dynamic application of Market Basket Analysis: analyzing campaign performance while it is still active.
Step 1: The Mid-Campaign Check
Imagine a promotion on a {Summer Dress}. After a week, an MBA report on just those orders can answer: "What else did these customers buy?". This reveals if the promotion had a positive halo effect on items like {Sandals} or {Sun Hats}, providing a basket-level ROI beyond just the promoted item.
Step 2: From Insight to Actionable Remarketing
This analysis fuels intelligent remarketing. If the data shows an affinity for {Sun Hats} among dress buyers, but hat sales were low, the business can create new, hyper-specific audiences.
- Audience 1 (Cross-Sell): Target customers who purchased the {Summer Dress} with ads for {Sun Hats}. The ad copy can be highly personalized: "Love your new dress? Complete the look with the perfect sun hat!".
- Audience 2 (Bundle Offer): Target users who viewed the {Summer Dress} but didn't buy with a bundle offer: "Still thinking it over? Get the Summer Dress + Sun Hat together and save 15%!"
This transforms Market Basket Analysis from a static planning tool into an agile instrument for continuous campaign optimization.
Your First Insight is a Click Away: Getting Started with Apus Nest
The principles of Market Basket Analysis provide a clear path to enhancing e-commerce performance. By uncovering the hidden relationships between products, businesses can strategically increase Average Order Value, improve the customer experience with relevant recommendations, and make smarter, data-driven inventory decisions. A platform like Apus Nest makes this analytical power accessible to any business.
There is no need for a background in data science to begin leveraging these insights. For those ready to move from guessing what customers want to knowing what they will buy next, the first step is straightforward. An interactive demo report is available to explore the platform's capabilities, or you can run its first report for free. For any questions, a support team is available at hello@apusnest.com. The path to unlocking the hidden revenue begins with the decision to look.